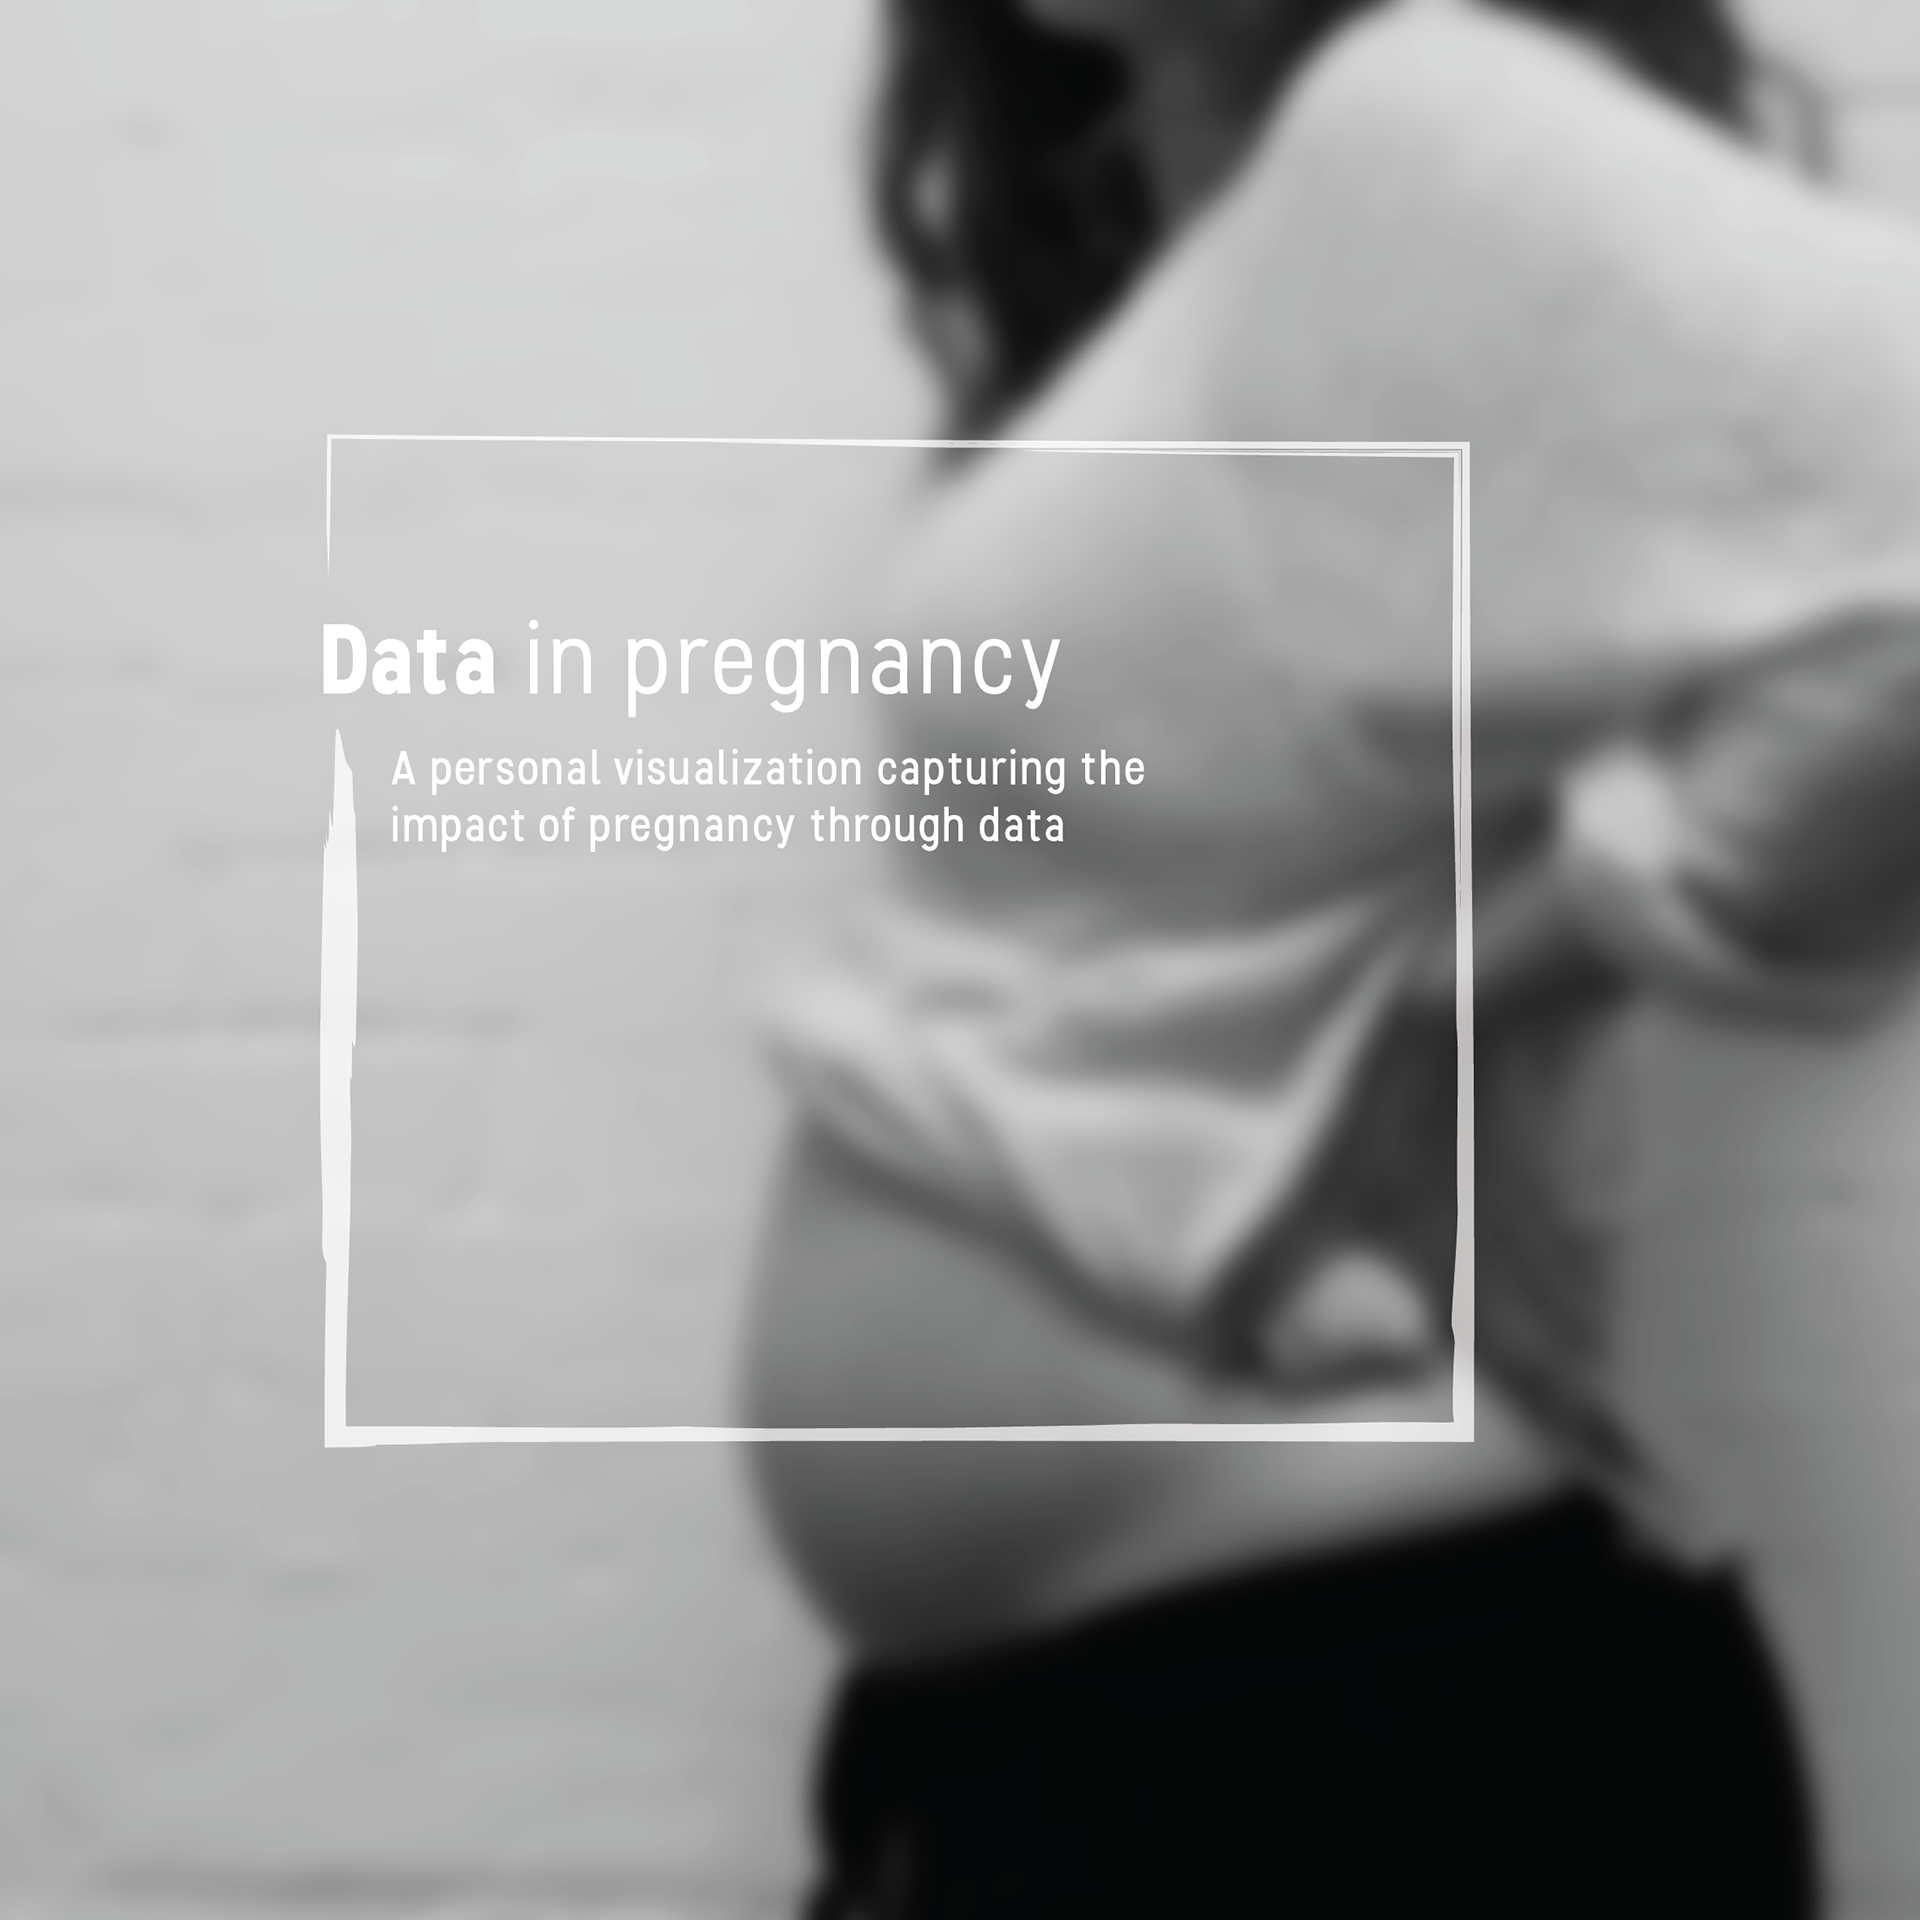
A personal visualisation capturing the impact of pregnancy through data
"Can a data visualization evoke empathy and activate us also at an emotional level, and not only at a cognitive one? Can looking at a data visualization make you feel part of a story of a human’s life?" (Lupi, Medium)
This is the story of a pregnancy narrated using data. It shows a sensorial picture of this personal journey. This type of data visualisation was a way for me to tell a story that sheds light on a special human condition. The soft data, which is the more intimate type of data focuses more on the human context around the numbers rather than the numbers themselves. In my opinion this softer data is essential in order to see the whole picture.
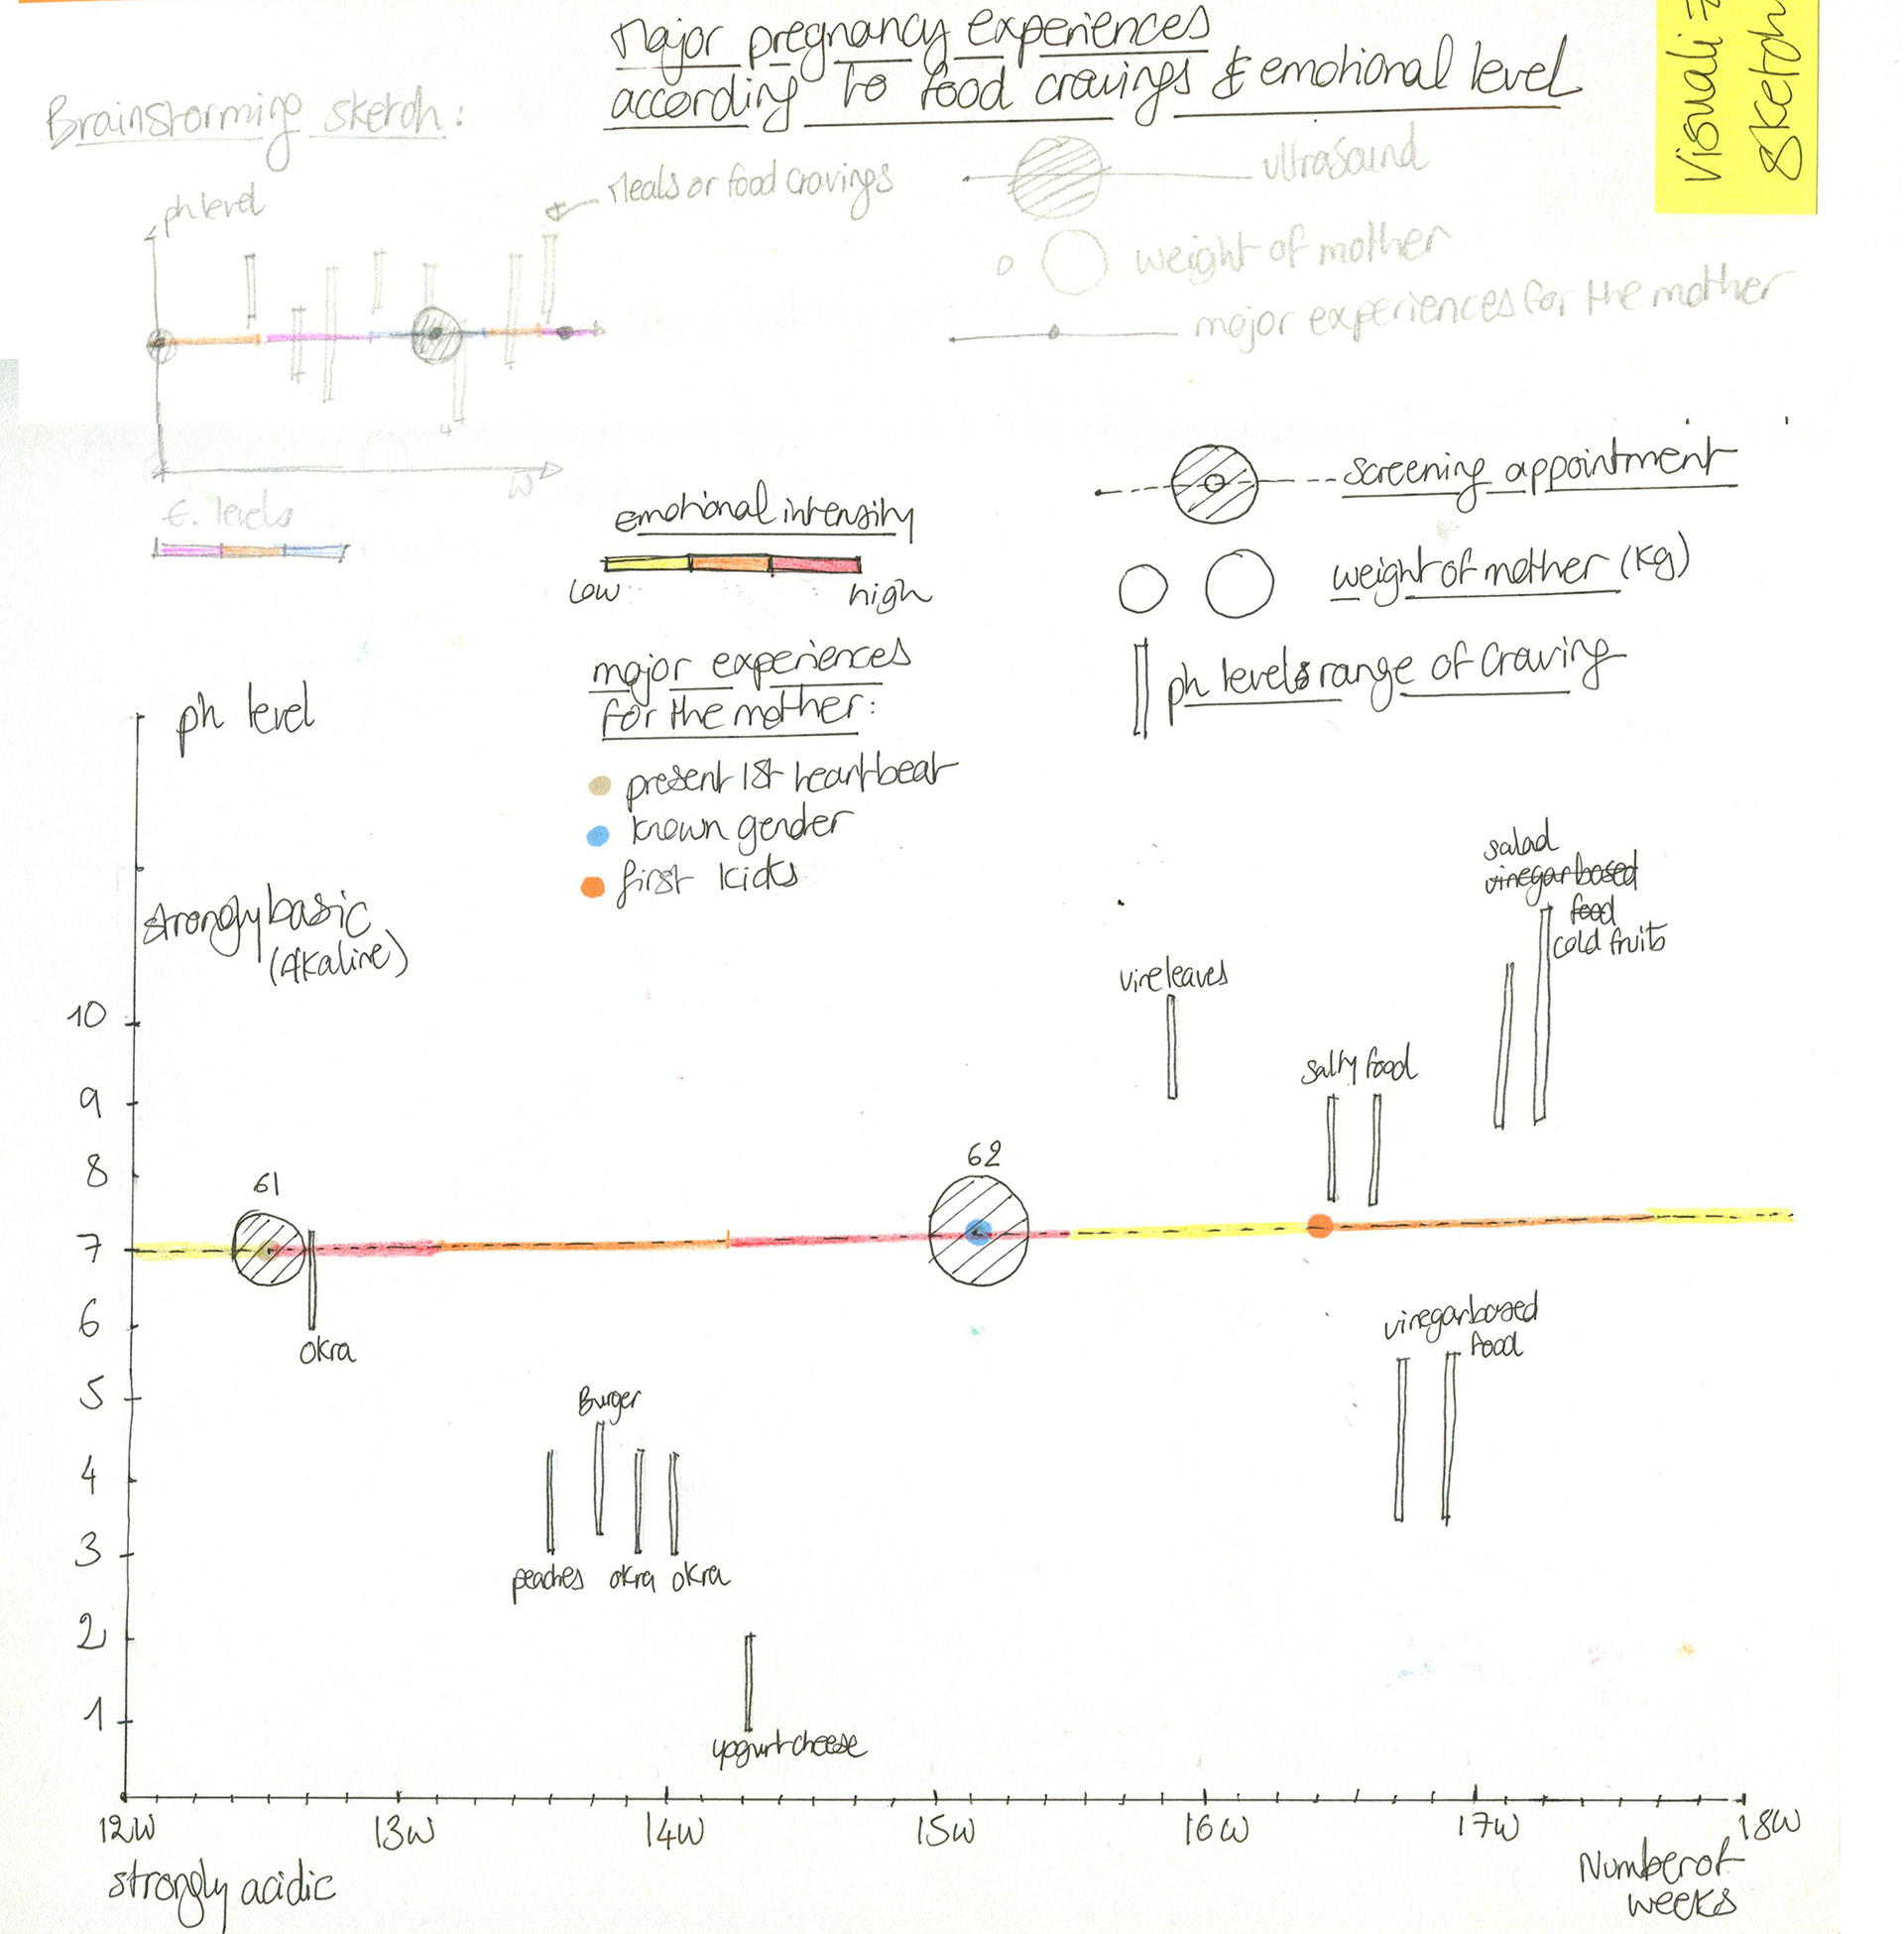
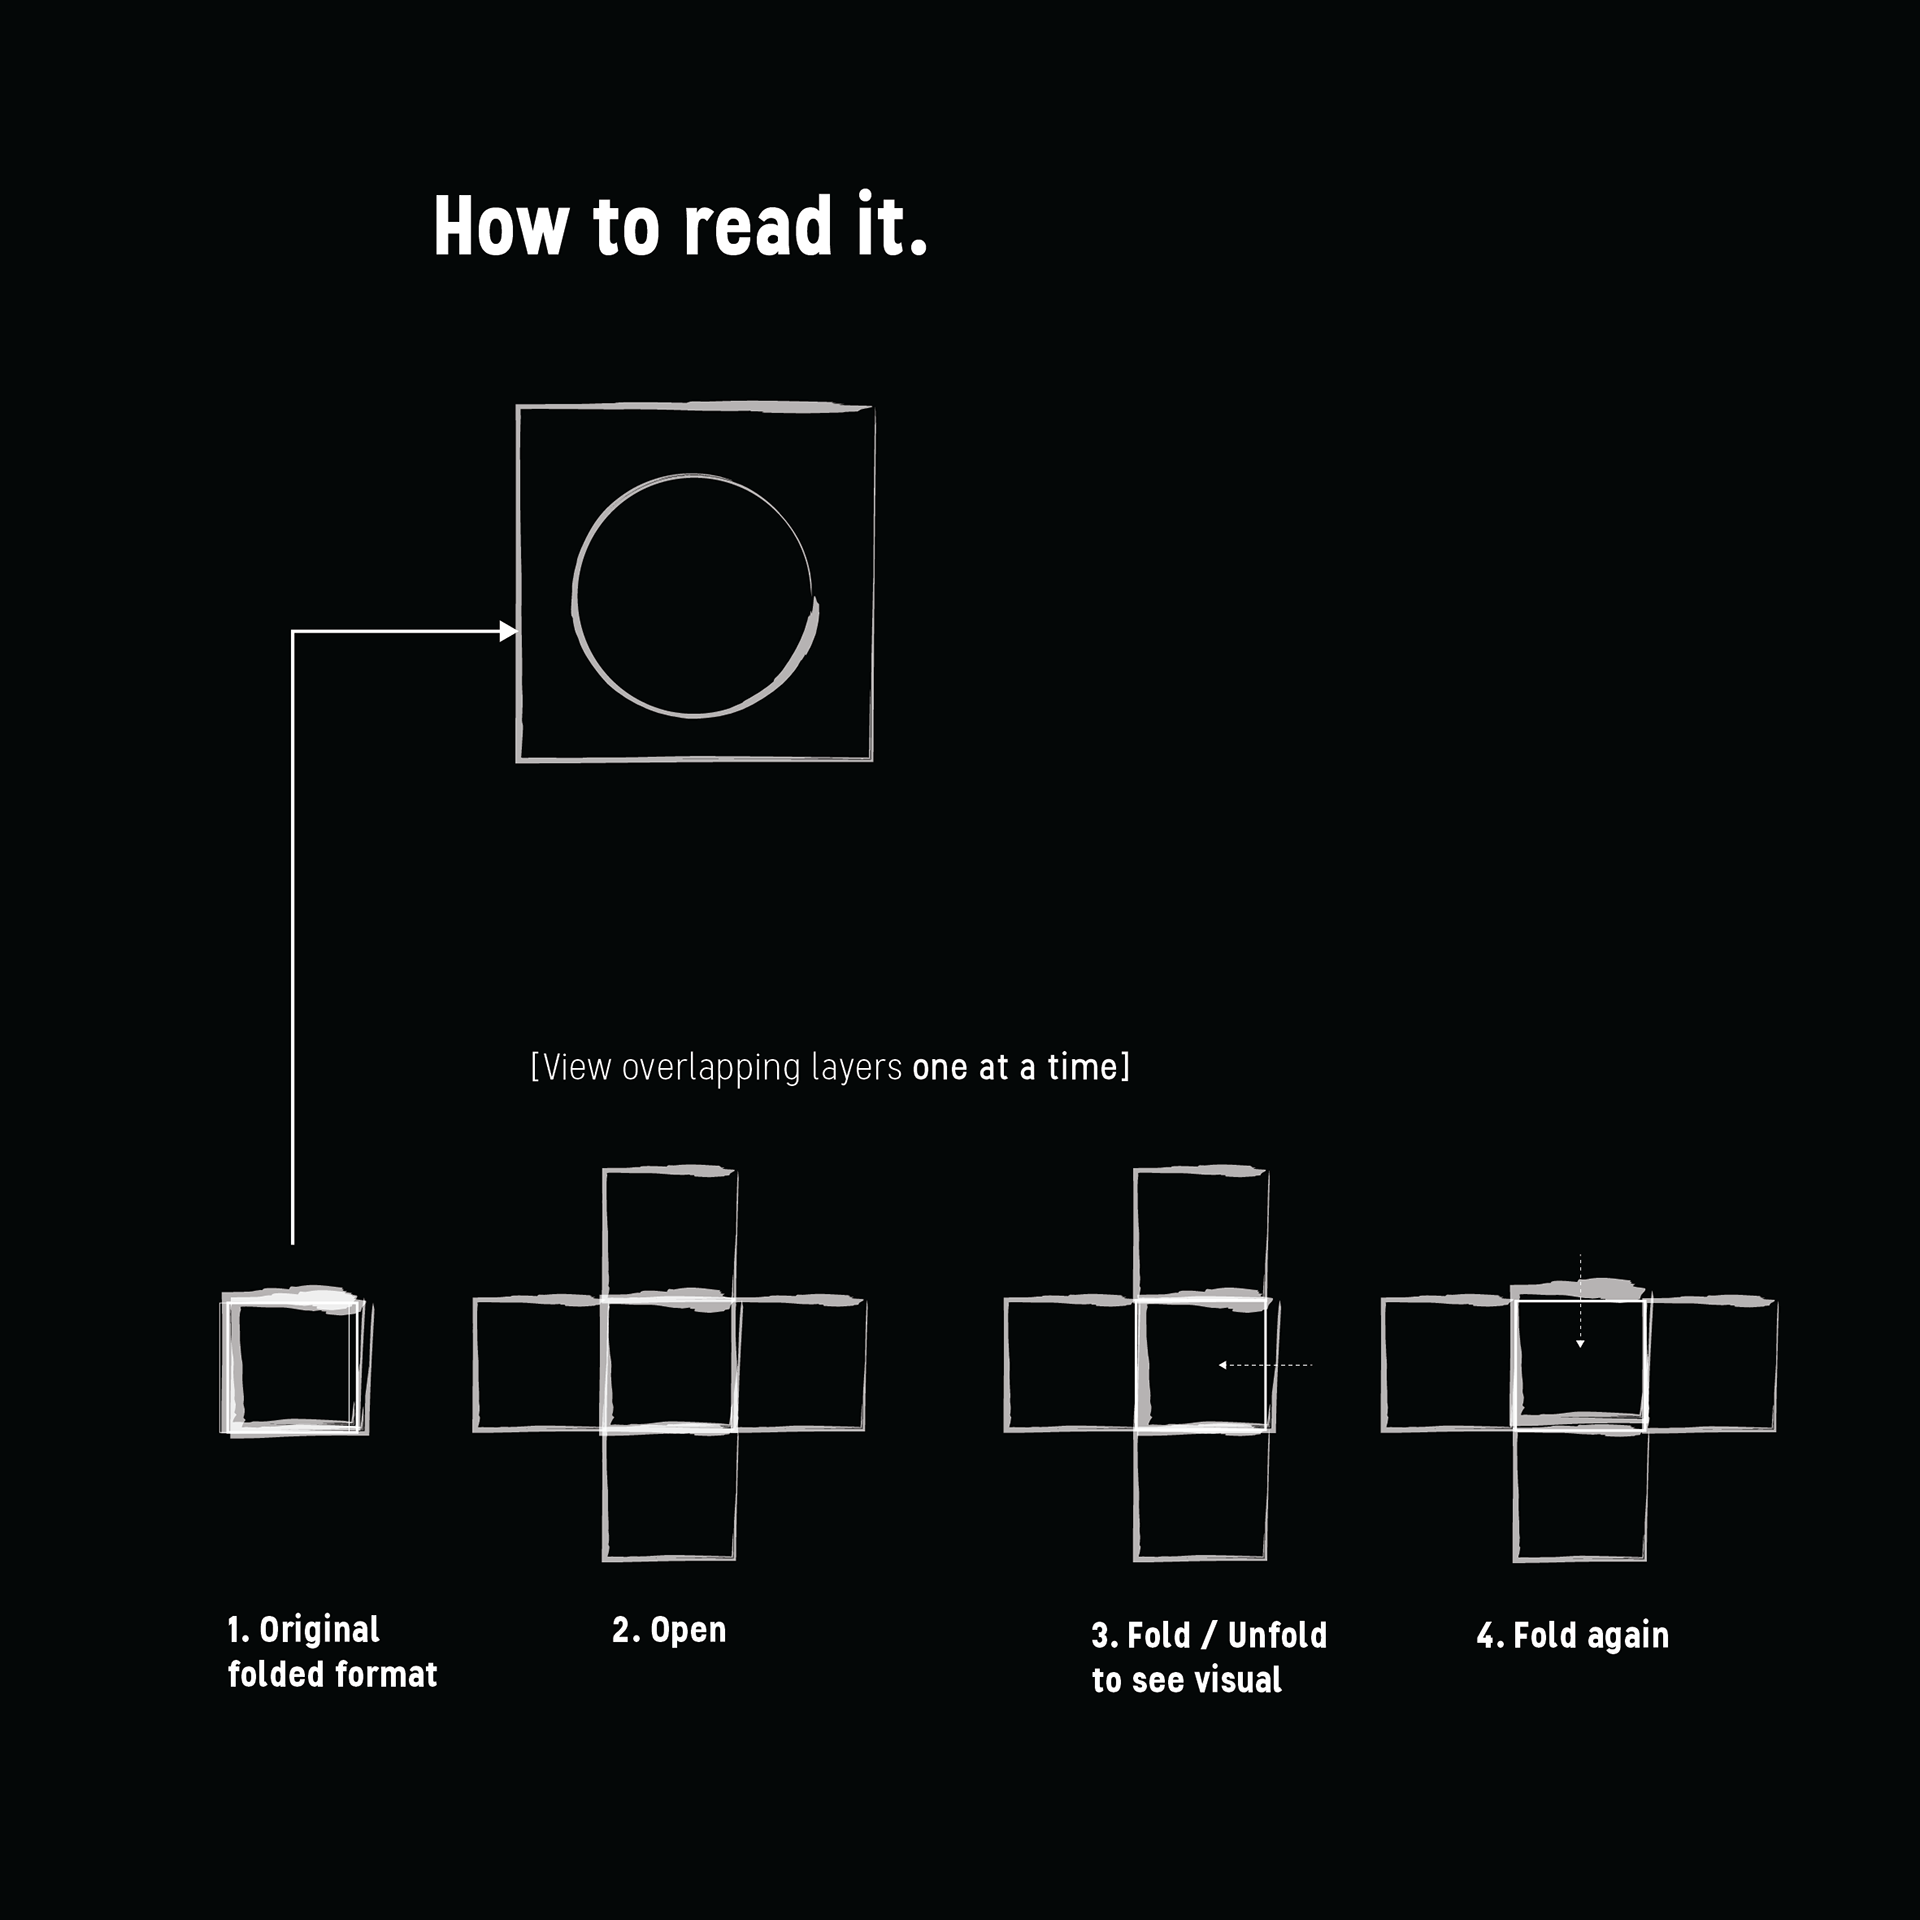
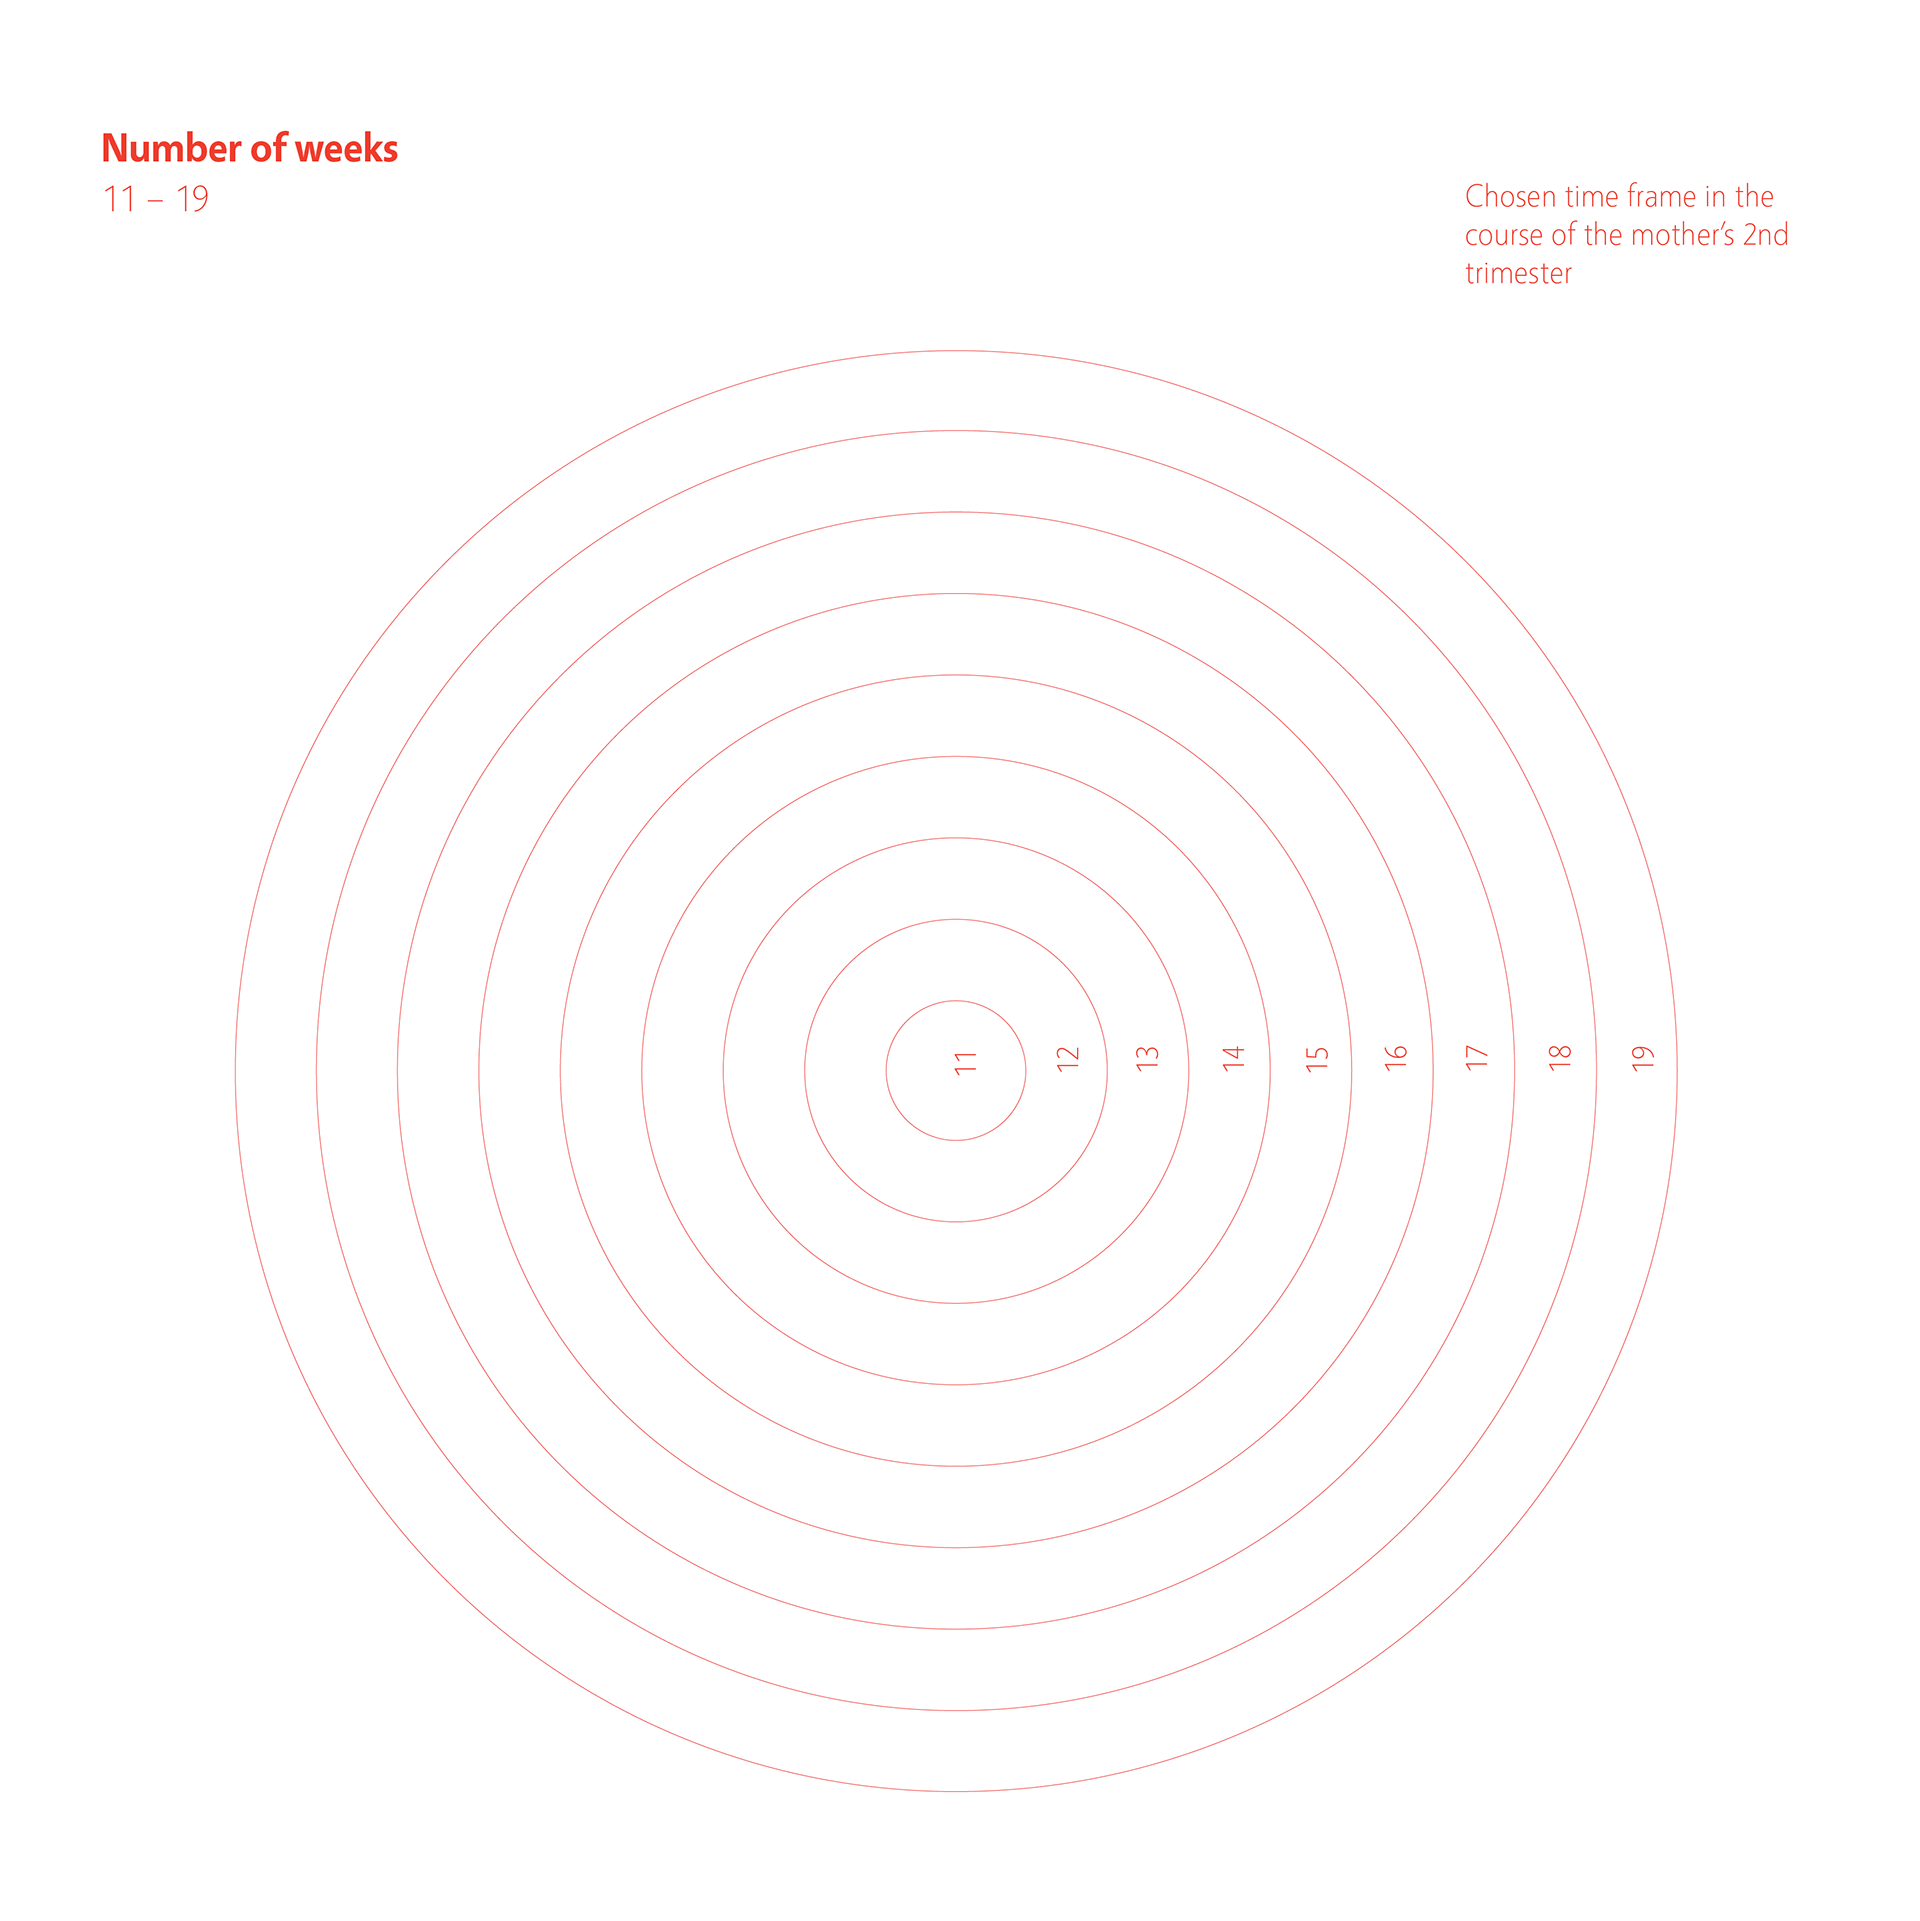
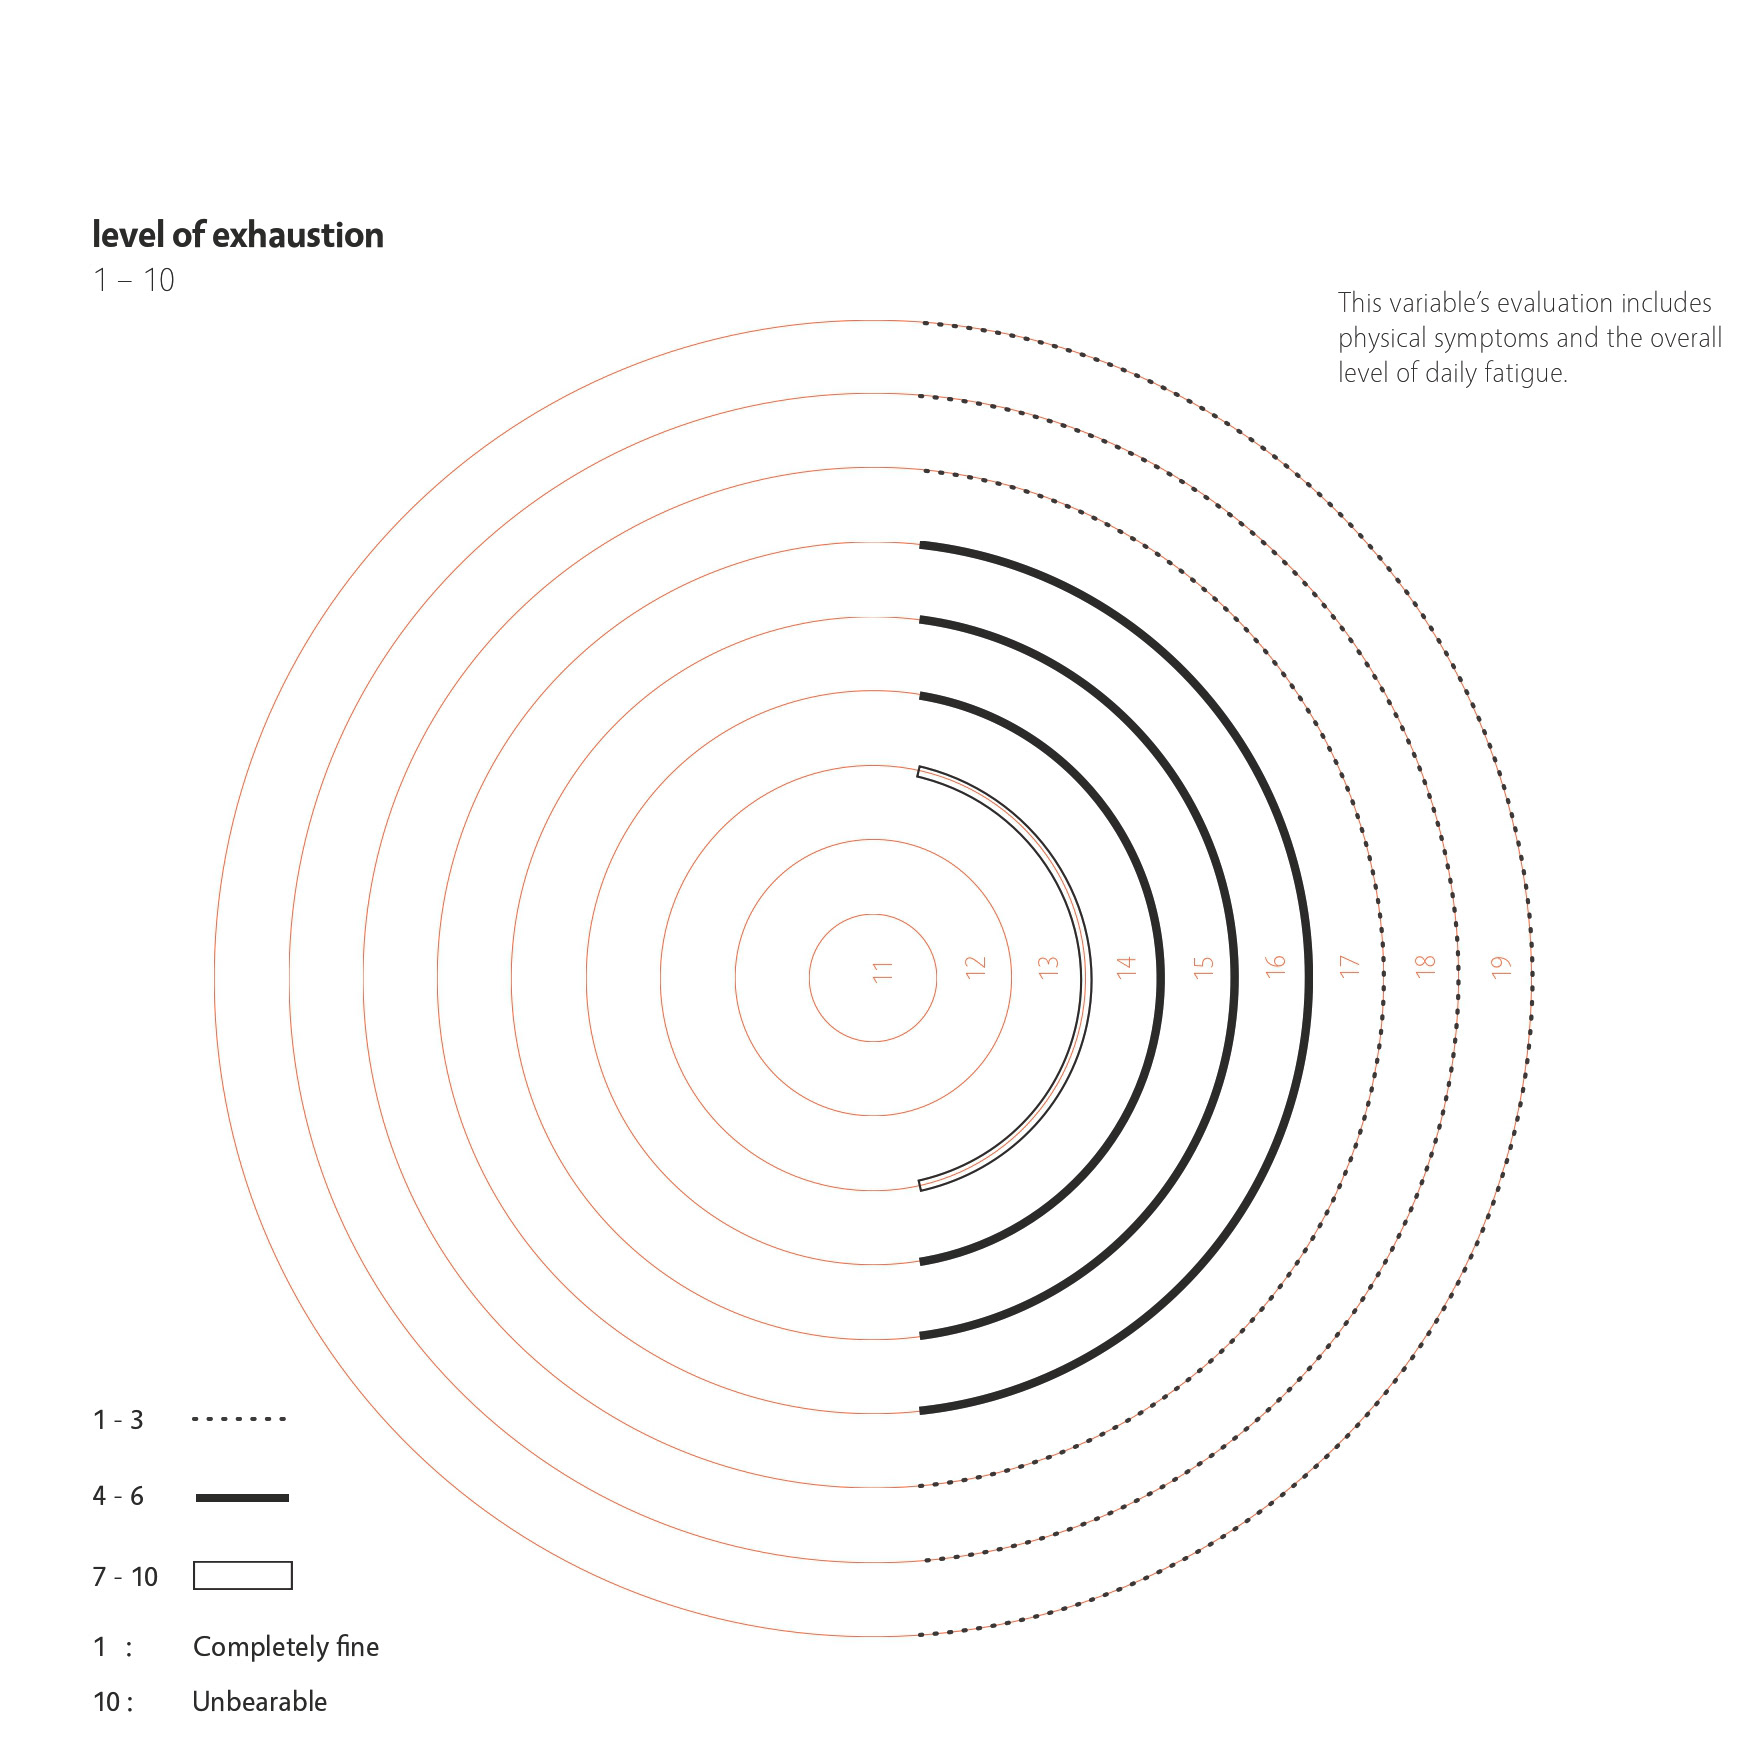
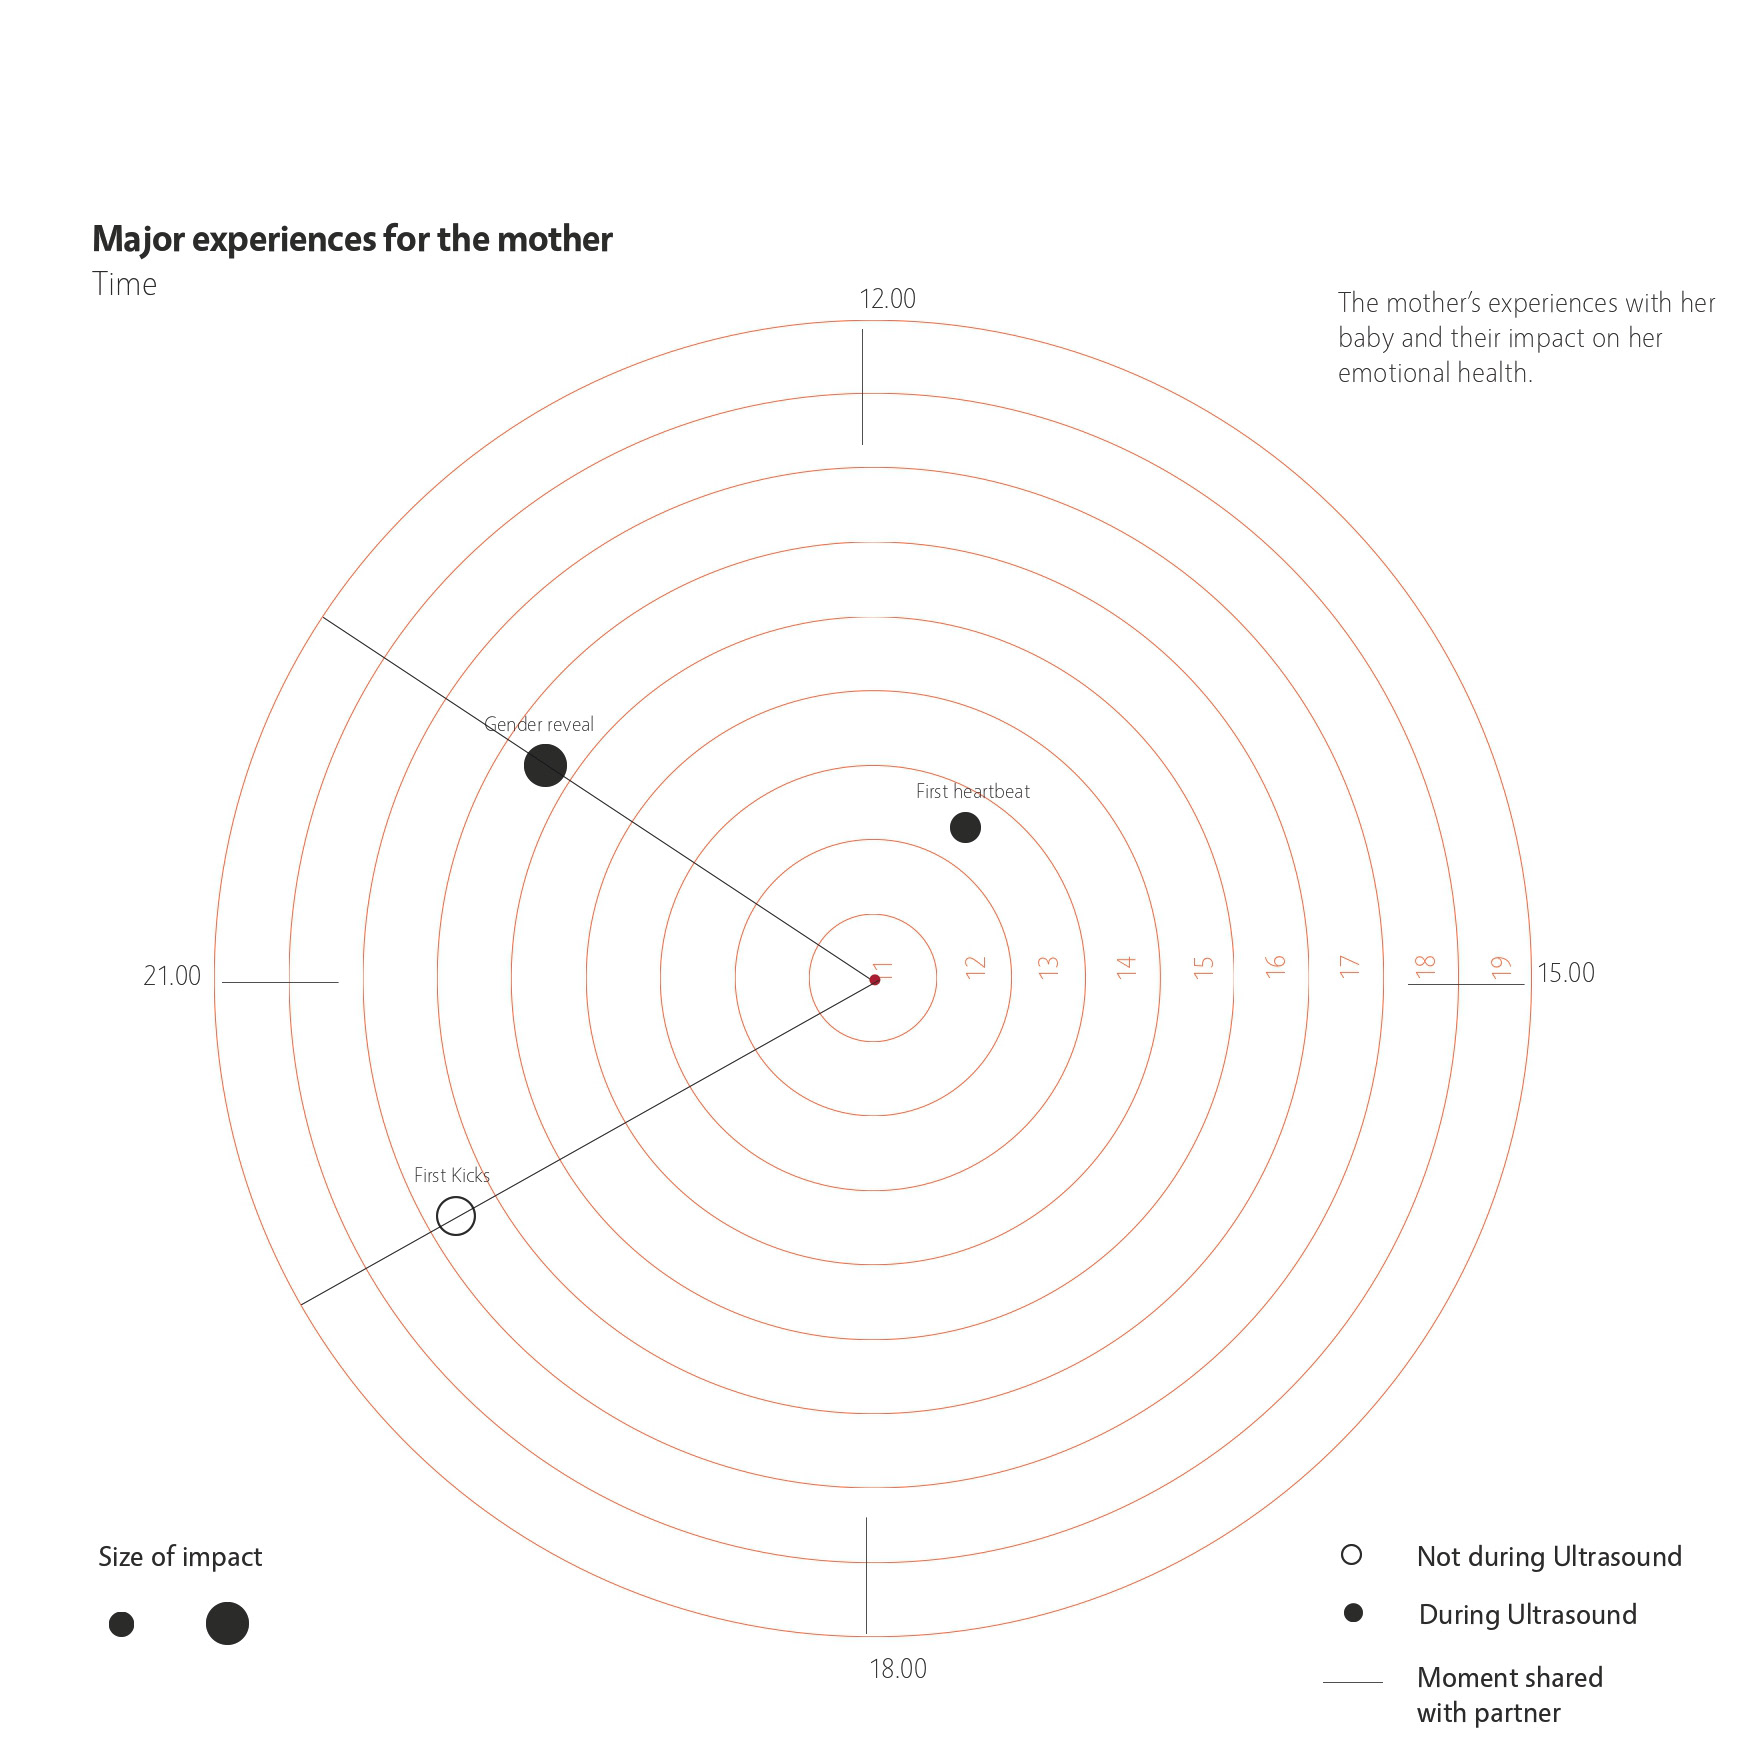
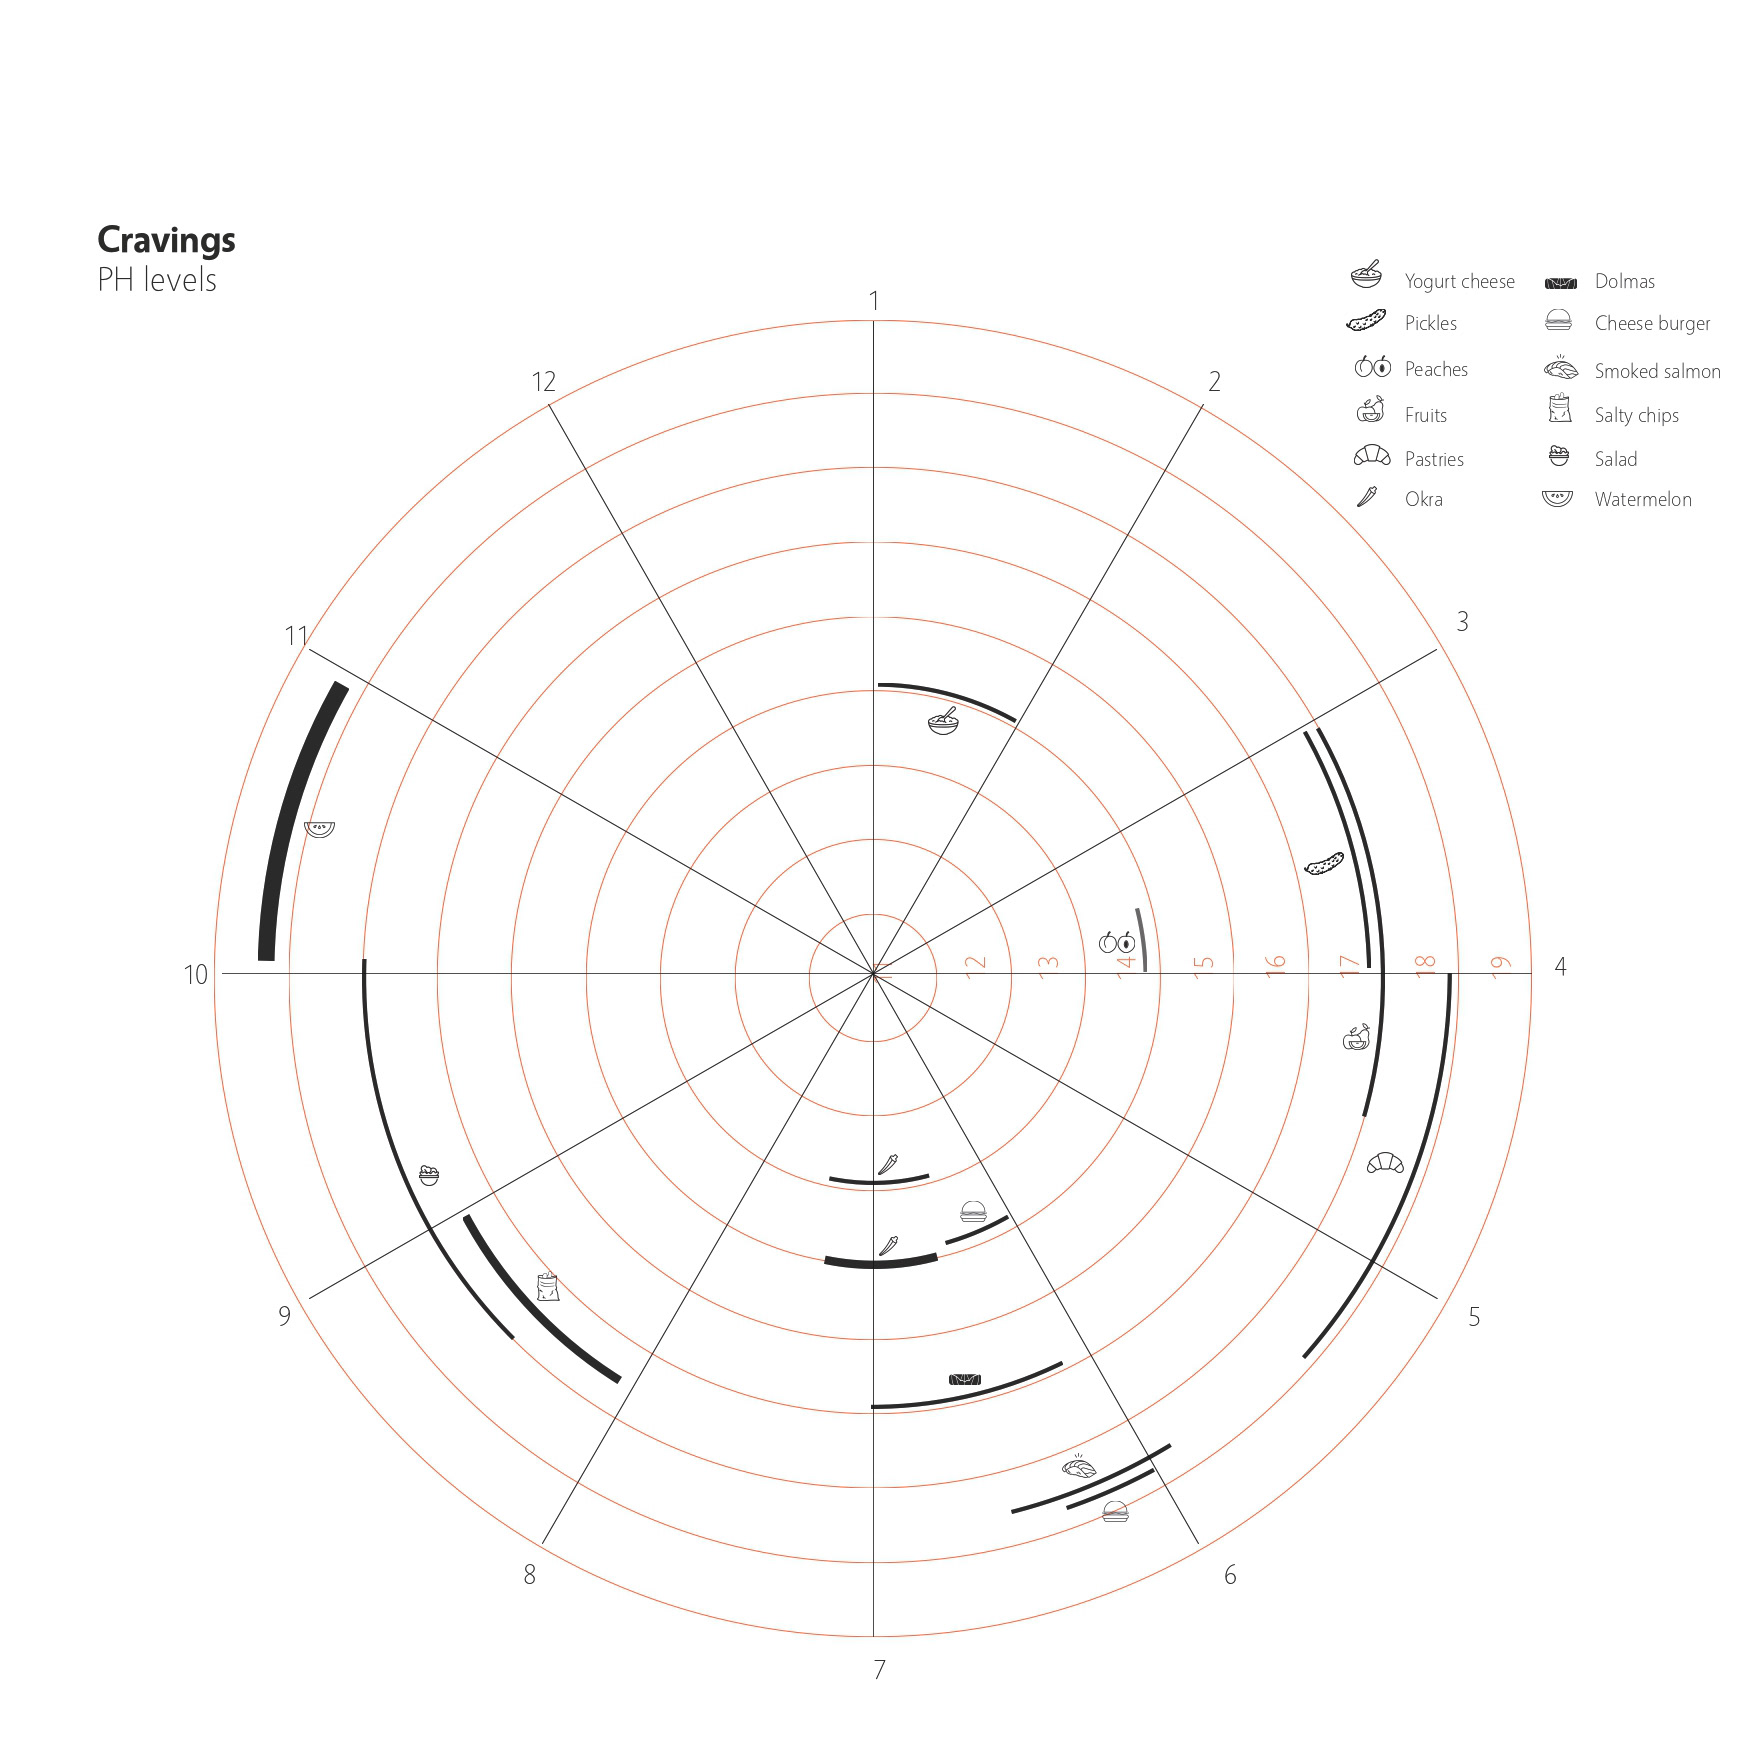
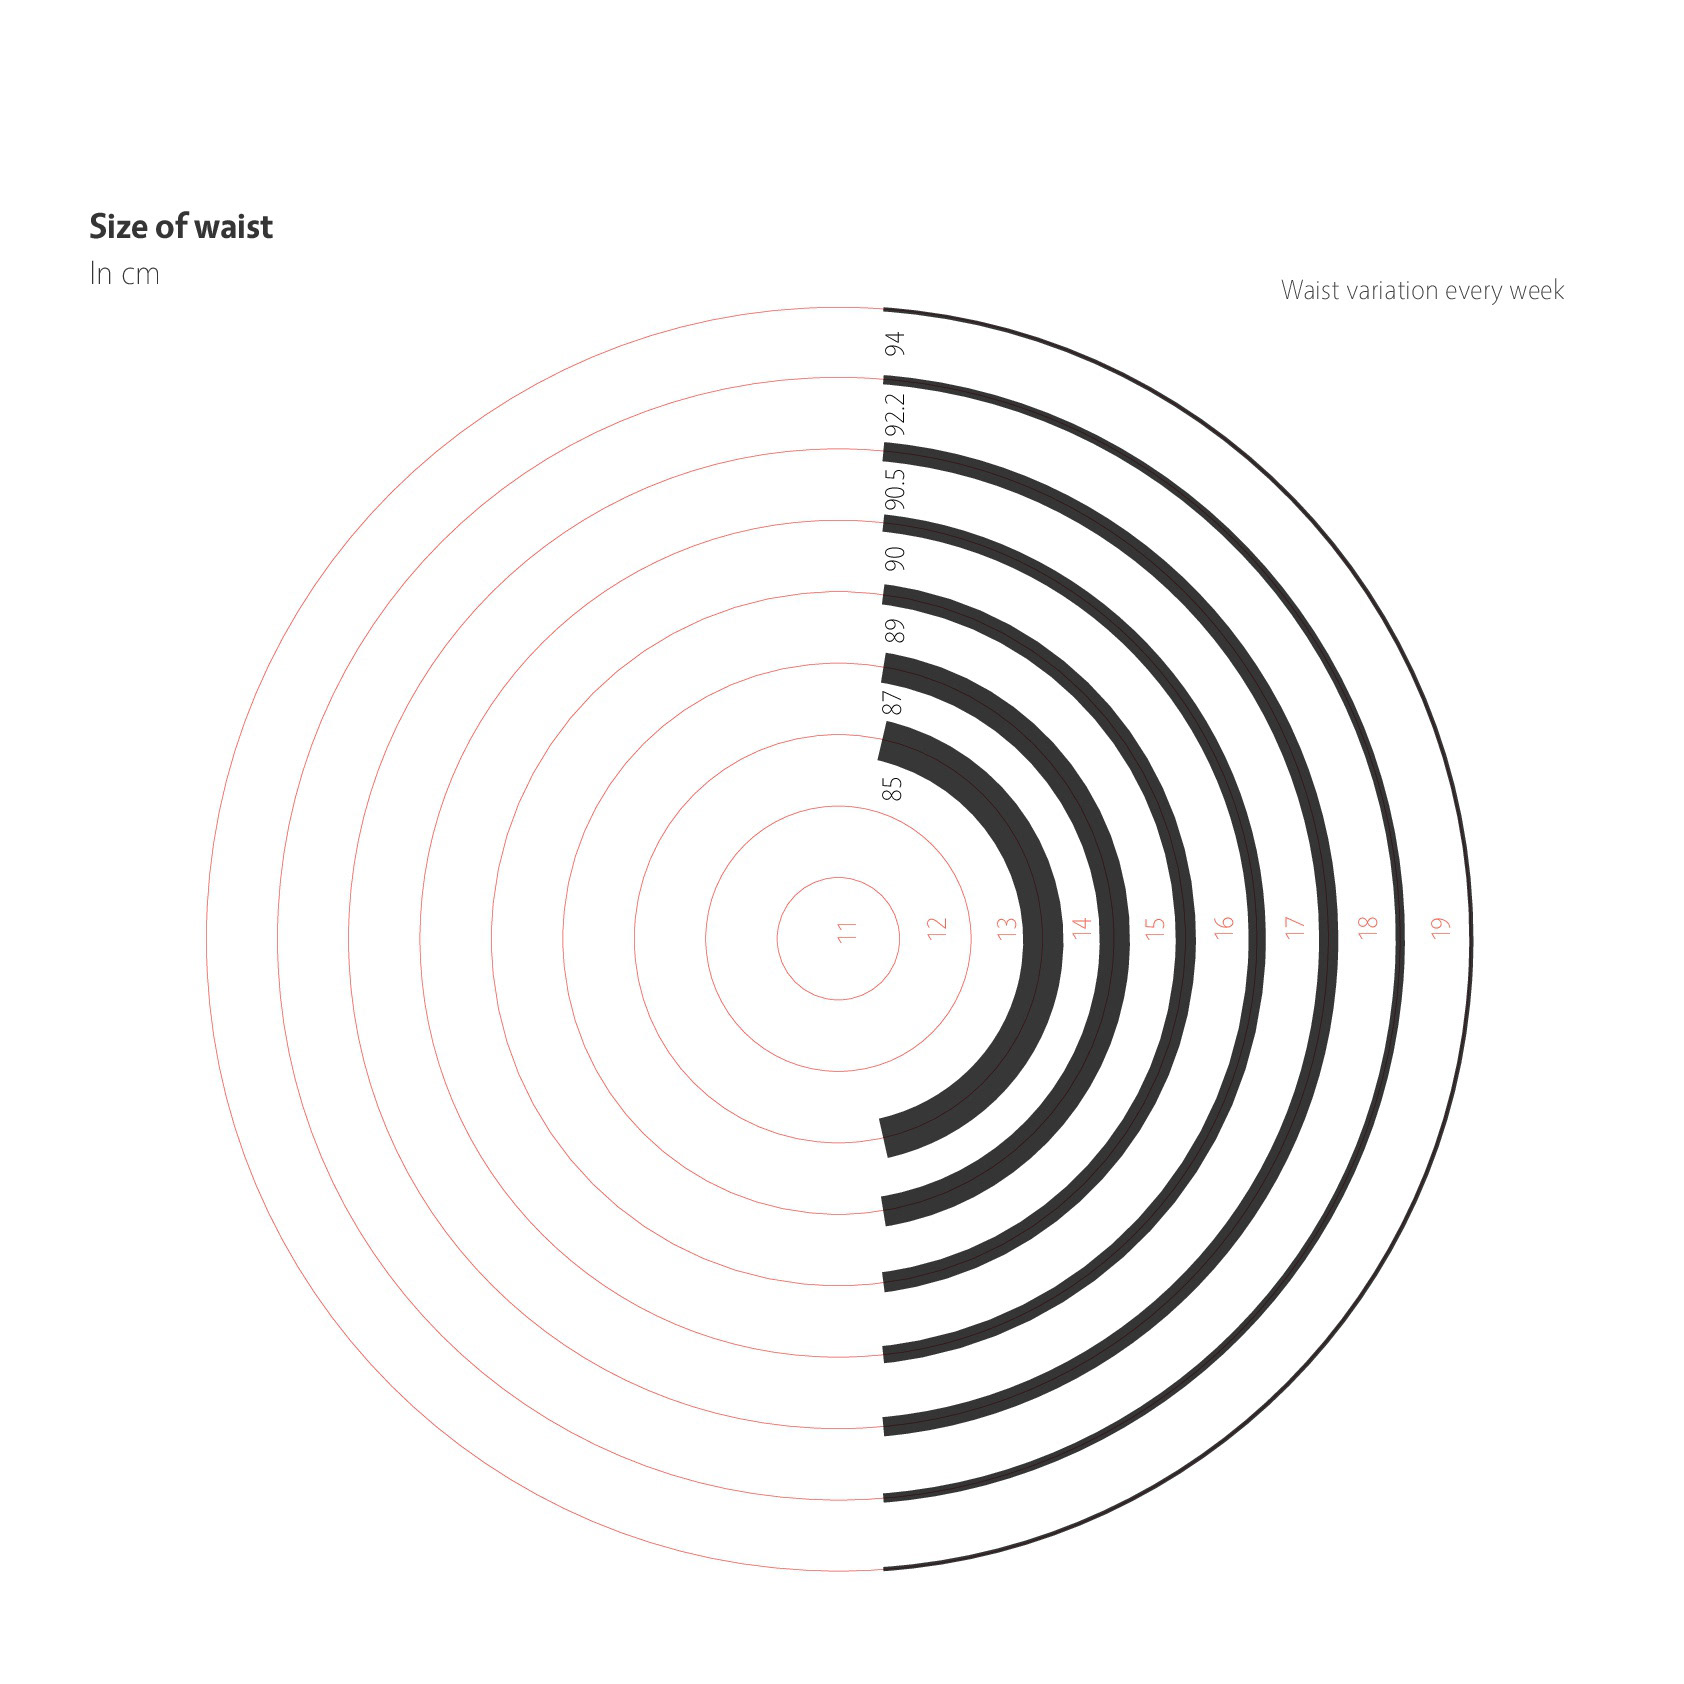
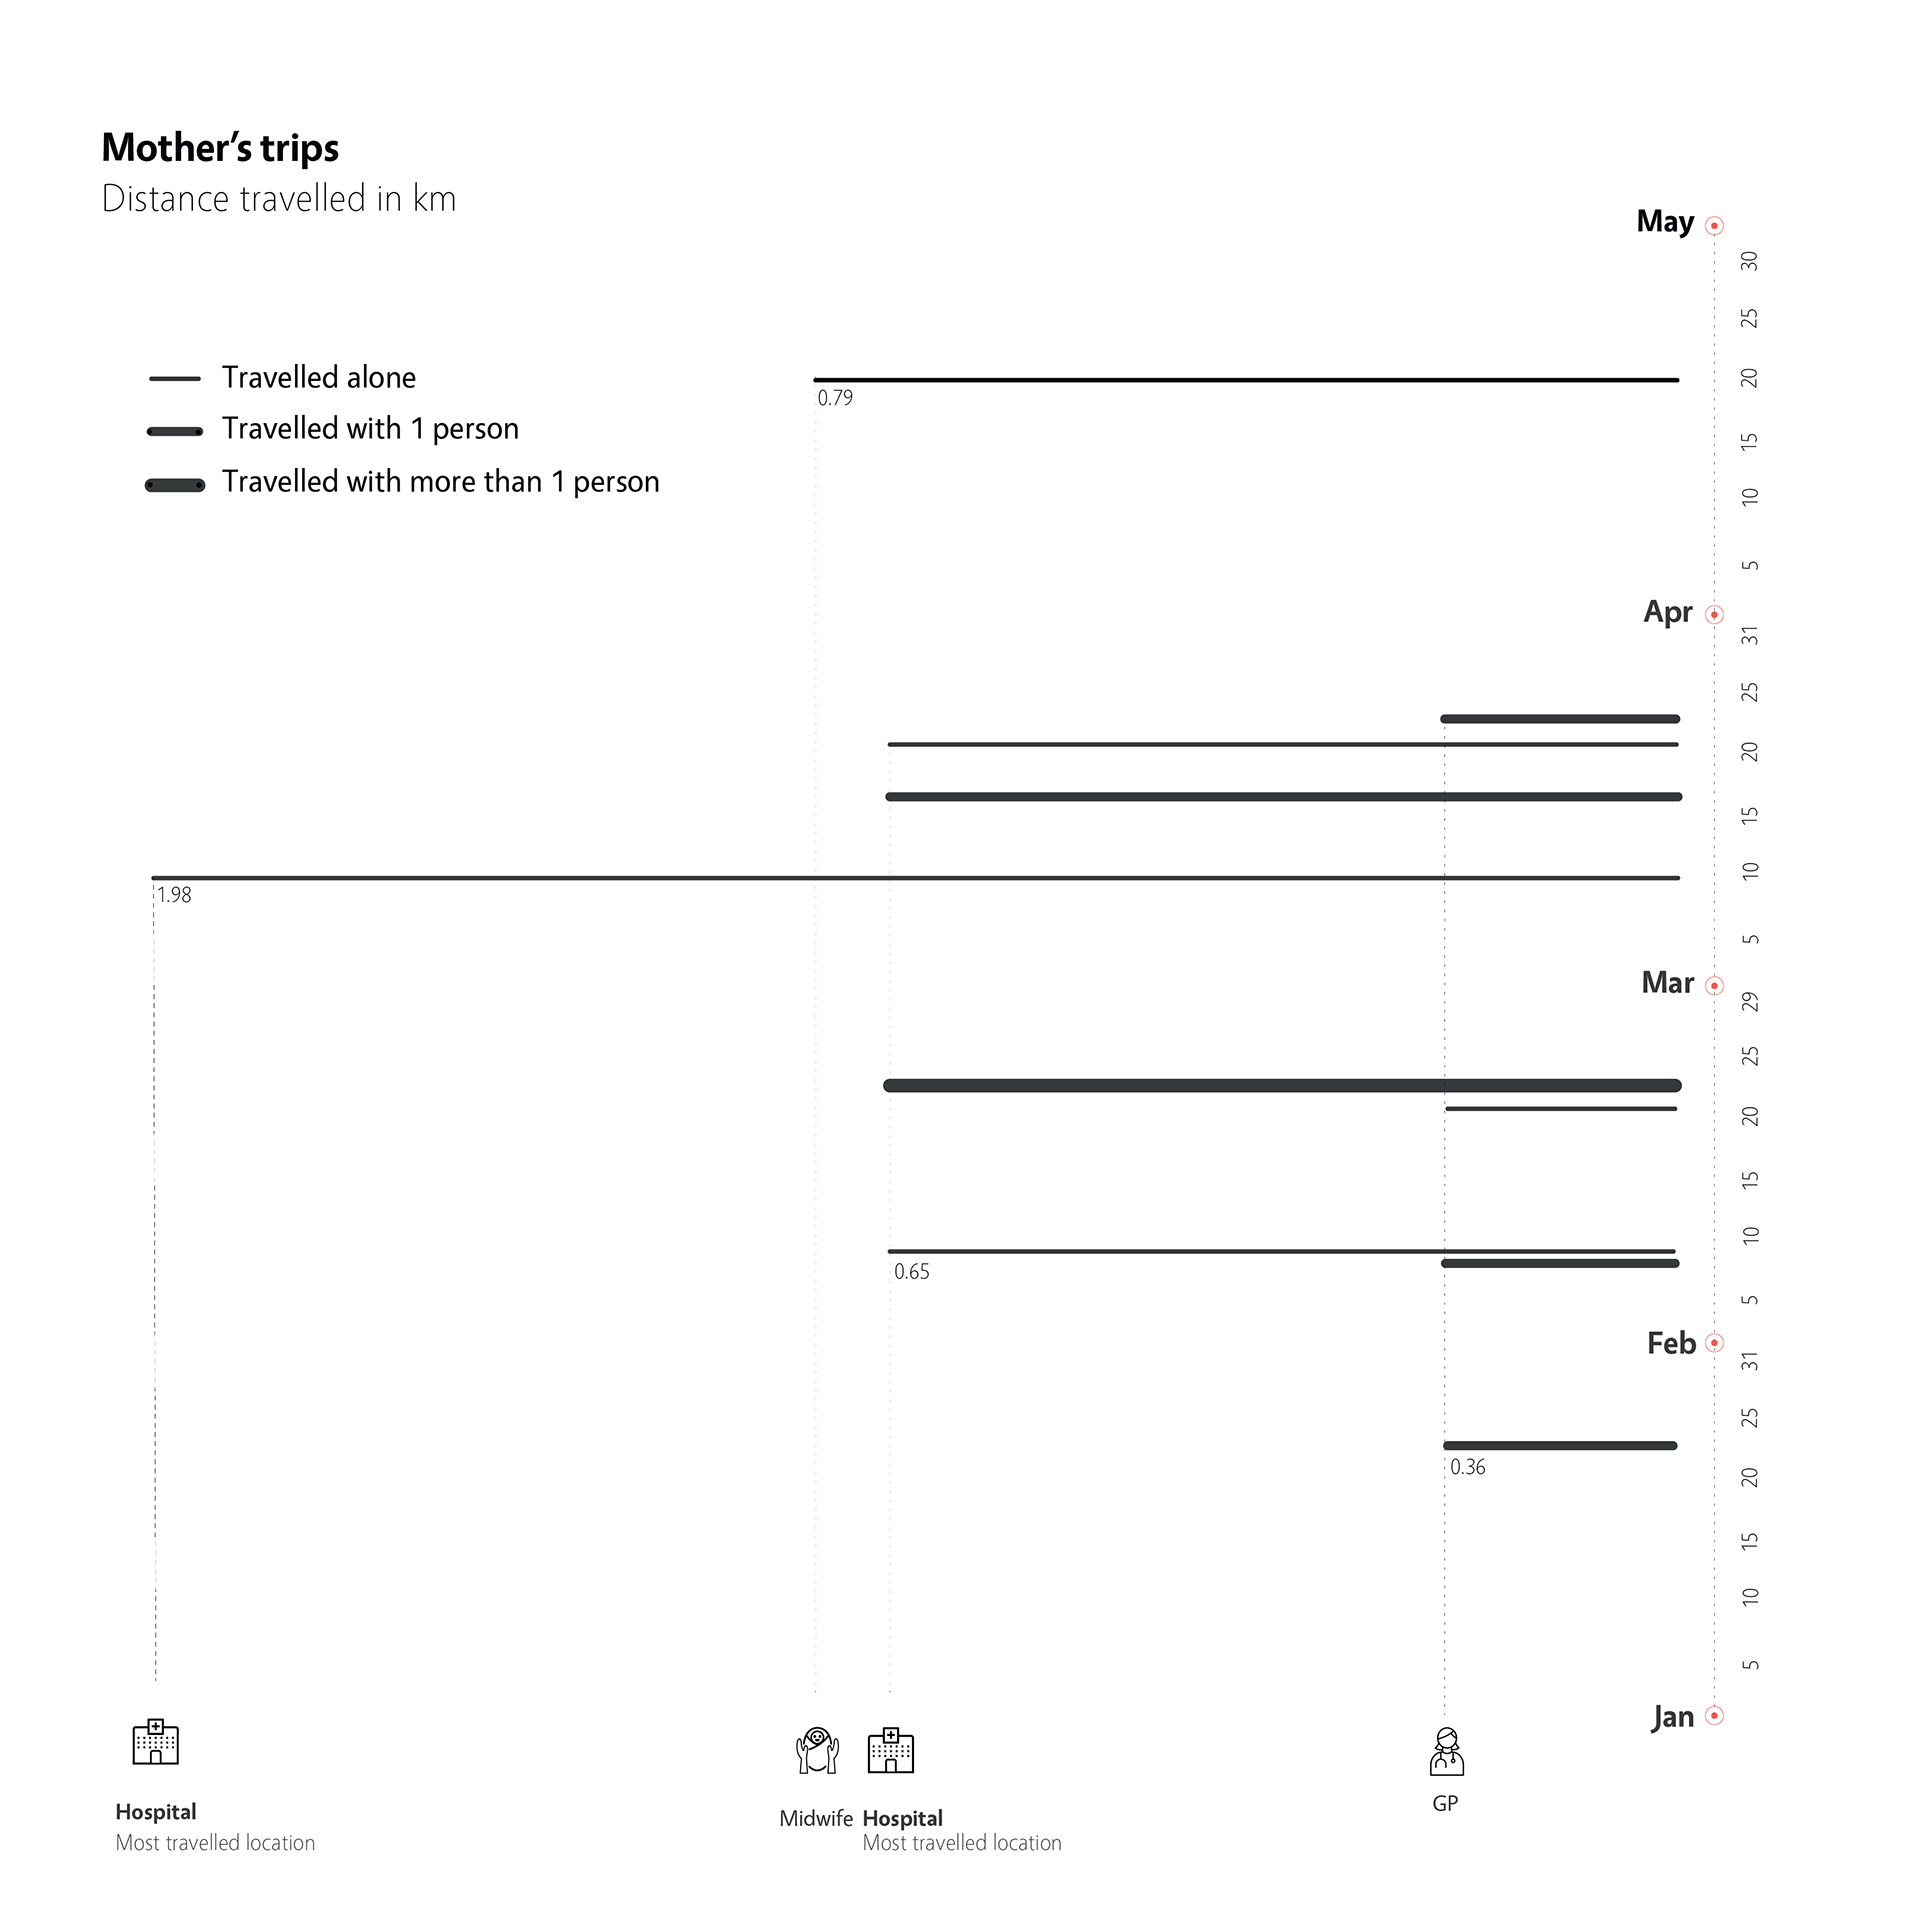
This project consists of different layers of parameters overlapping on a constant layer showing the number of pregnancy weeks. The parameters are: Cravings - Major experiences - Levels of exhaustion - Size of waist.
Inspired by the Data Humanism concept created by Giorgia Lupi.


Experimentation with photographic visualisation
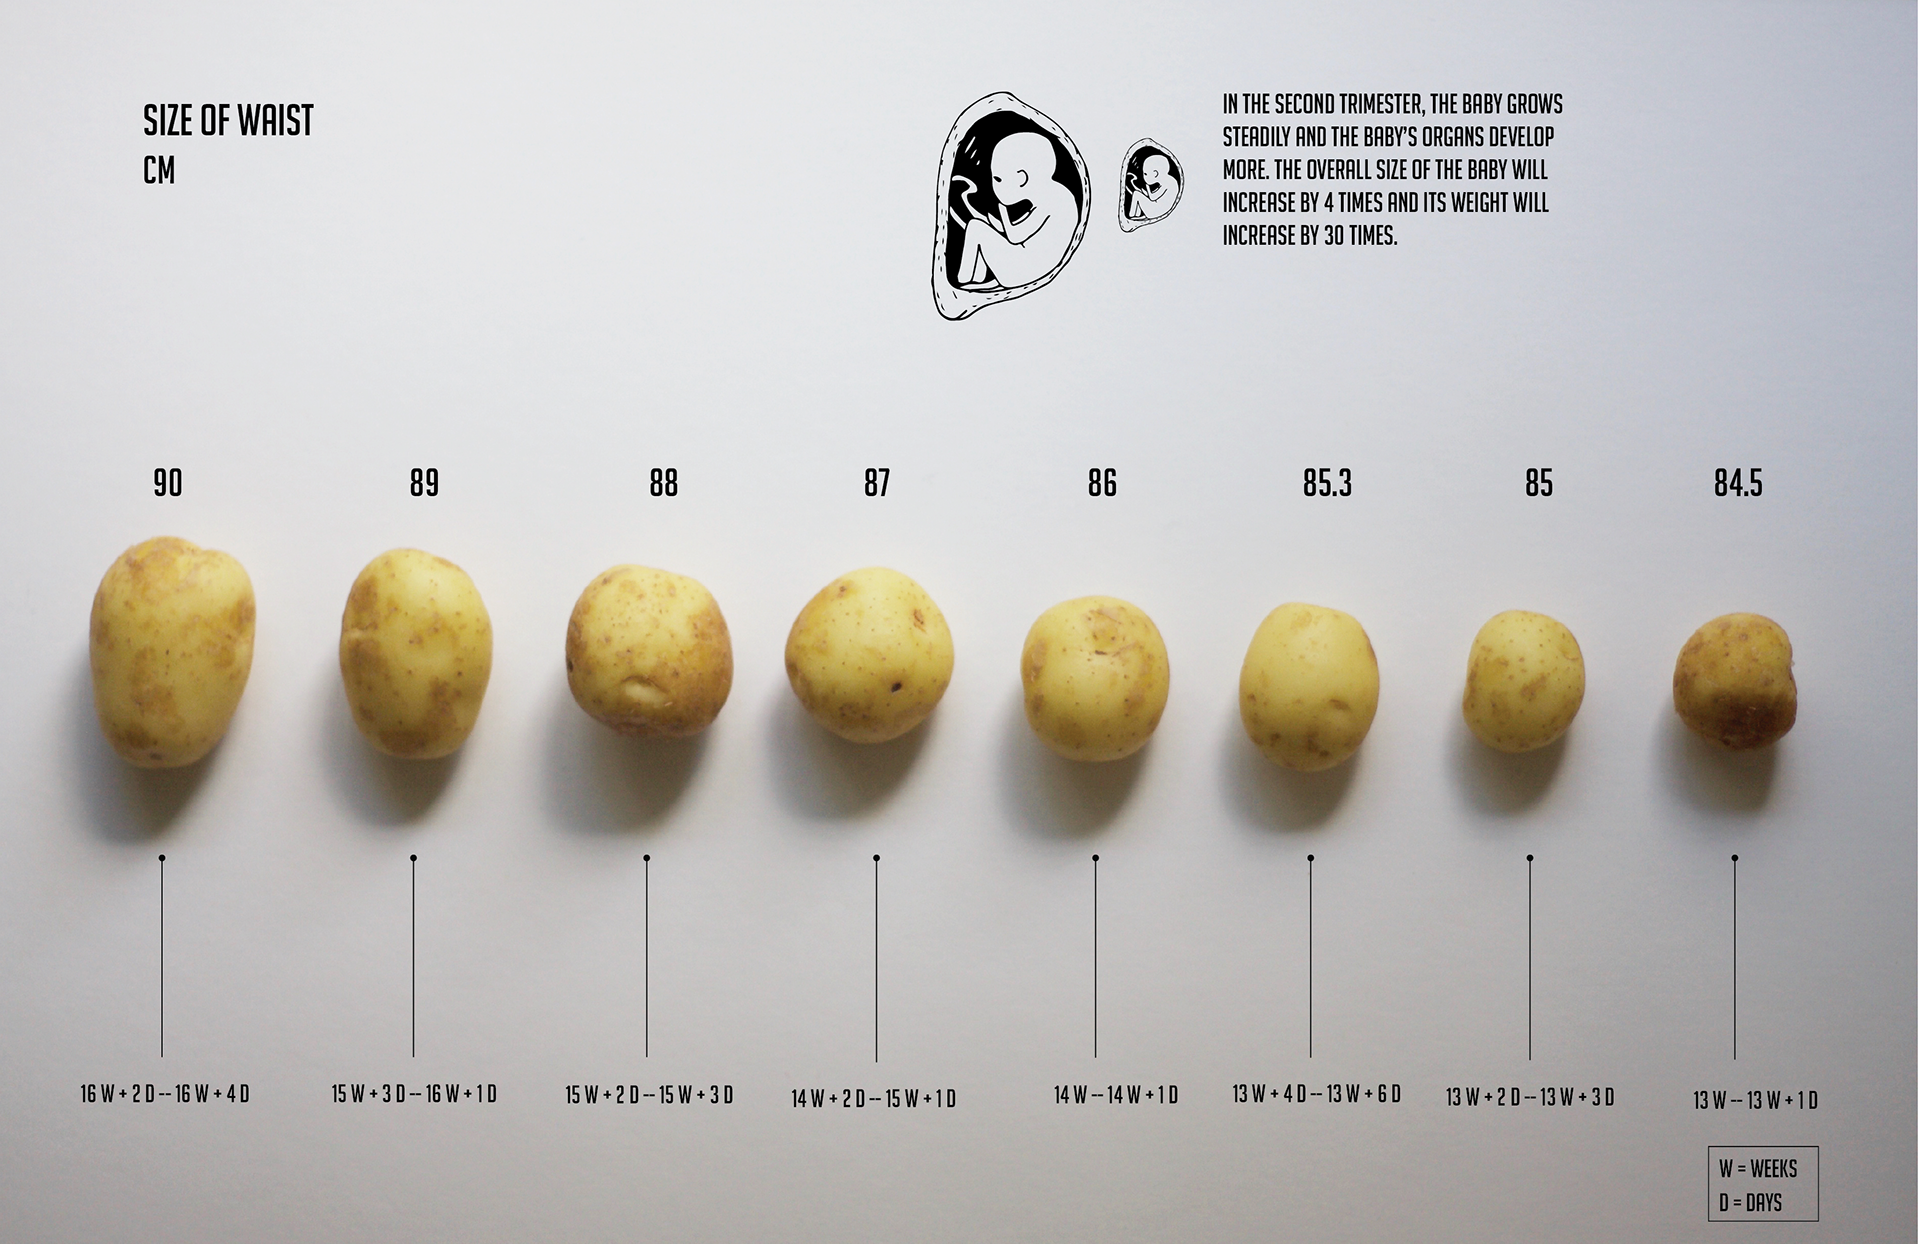
Photographic visualisation using potatoes to represent the womb according to the size of the waist over time
Manual data collection / preliminary sketches